Visualize Data using Amazon QuickSight – AWS Project
In the realm of data-driven decision-making, the ability to transform raw data into actionable insights is paramount. Enter Amazon QuickSight – a powerful business intelligence tool that empowers organizations to visualize data, uncover trends, and make informed decisions with ease.
In this project, we’ll embark on a journey to explore the capabilities of Amazon QuickSight and demonstrate how it can be used to create compelling visualizations that drive business success.
For today’s project, we’ll be using two AWS services: Amazon S3 and Amazon QuickSight.
Step 1: Downloading the Data(Data Preparation)
Every journey begins with preparation, and our first step is to gather and prepare the data for visualization. Whether it’s sales figures, customer demographics, or website analytics, ensure your data is clean, organized, and ready for analysis. We can import your data into Amazon QuickSight from various sources, including Amazon S3, Amazon RDS, Amazon Redshift, and more.
Here, We’ll be using a dataset provided by Bright Data, which contains a list of 50,000 best-selling products on Amazon.com. You can download the Dataset file from here: Amazon DataSet and also download the manifest.json . Save both the files we need it later.
The dataset is a subset of a larger dataset provided by Bright Data, a leading data collection company. Using a real-life dataset from Bright Data makes data visualization easier and eliminates the need for web scraping.
Step 2: Creating Amazon S3 Bucket
- Log in to your AWS Management Console.
- Navigate to the Amazon S3 service.
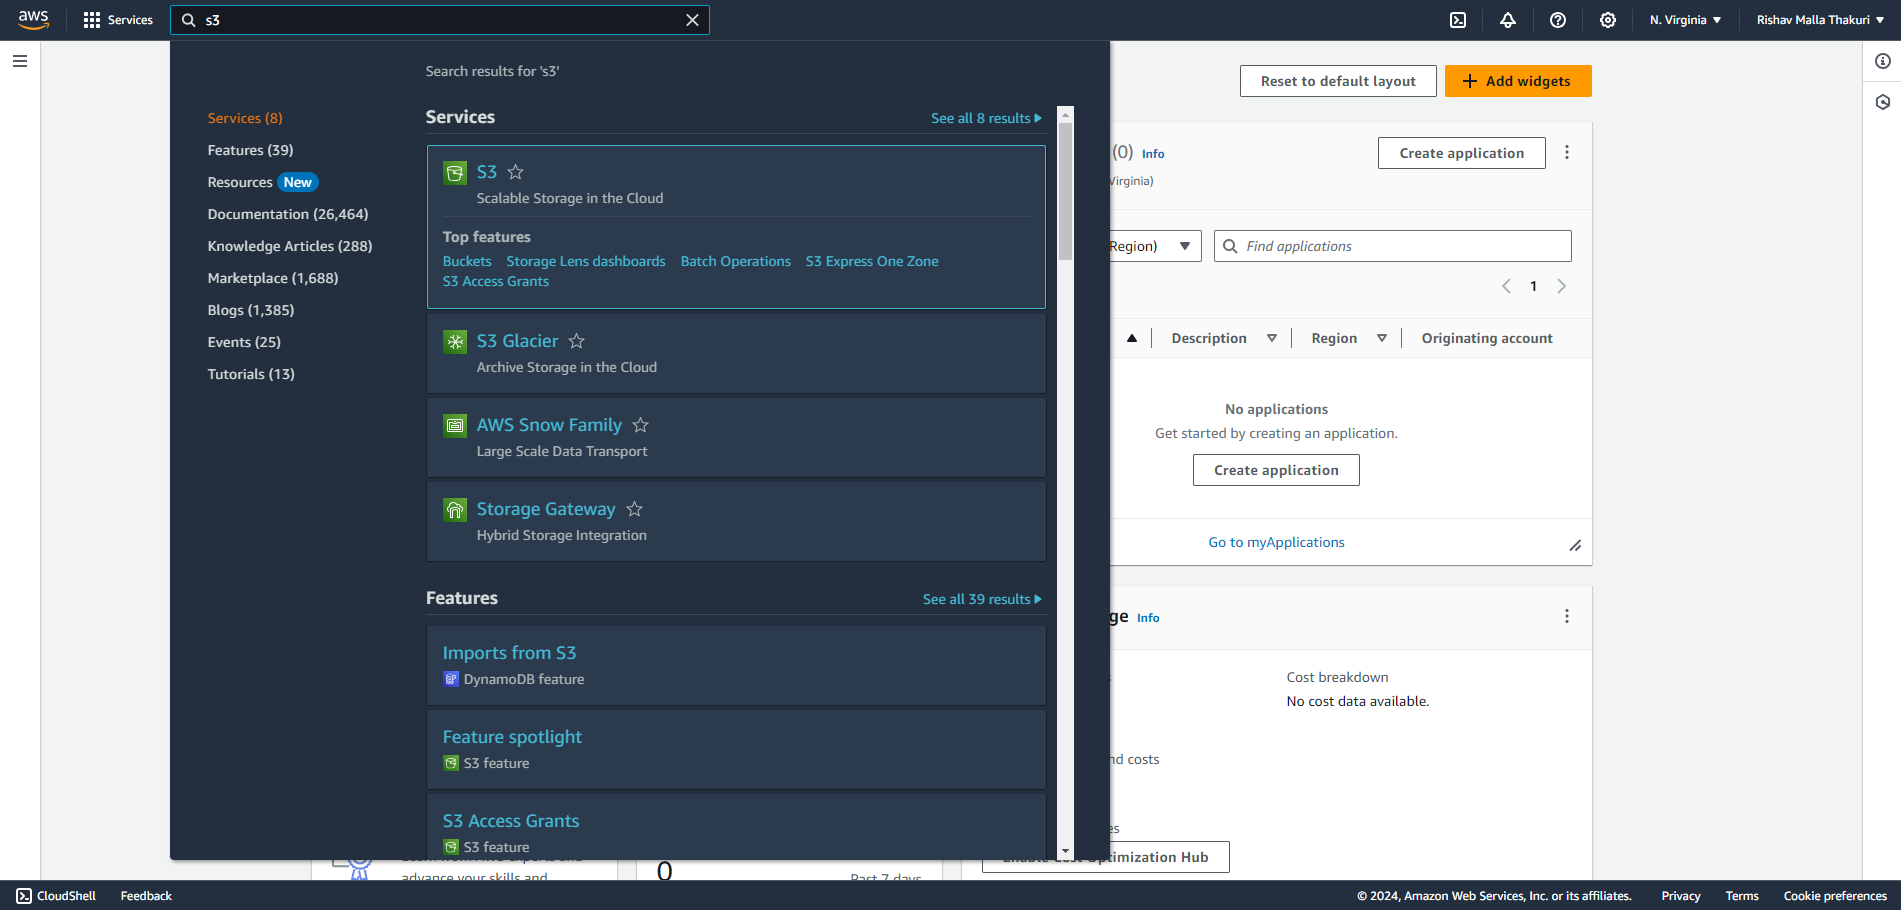
3. Click on “Create bucket”.
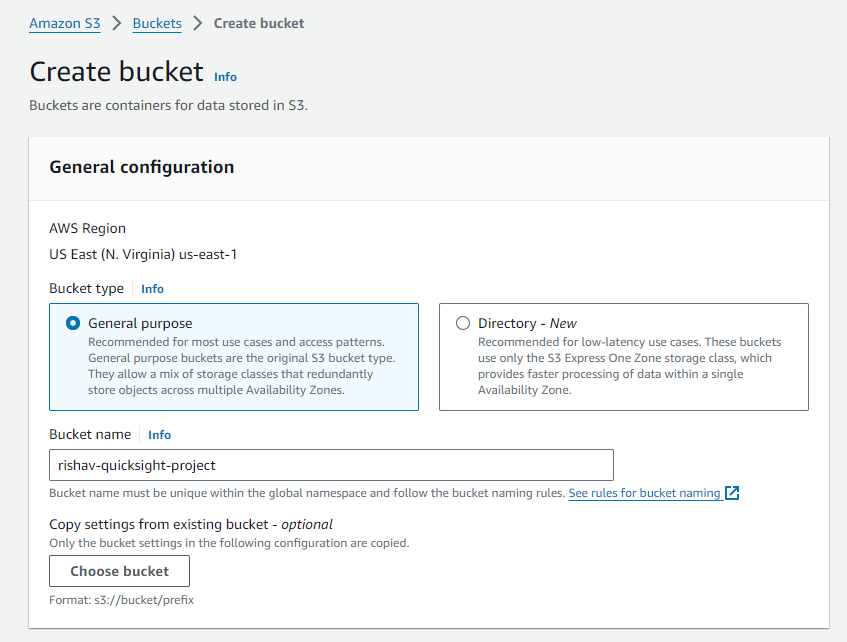
4. Choose a globally unique name for your bucket and select the region where you want to create it.
5. Leave the default settings or configure additional options as needed.
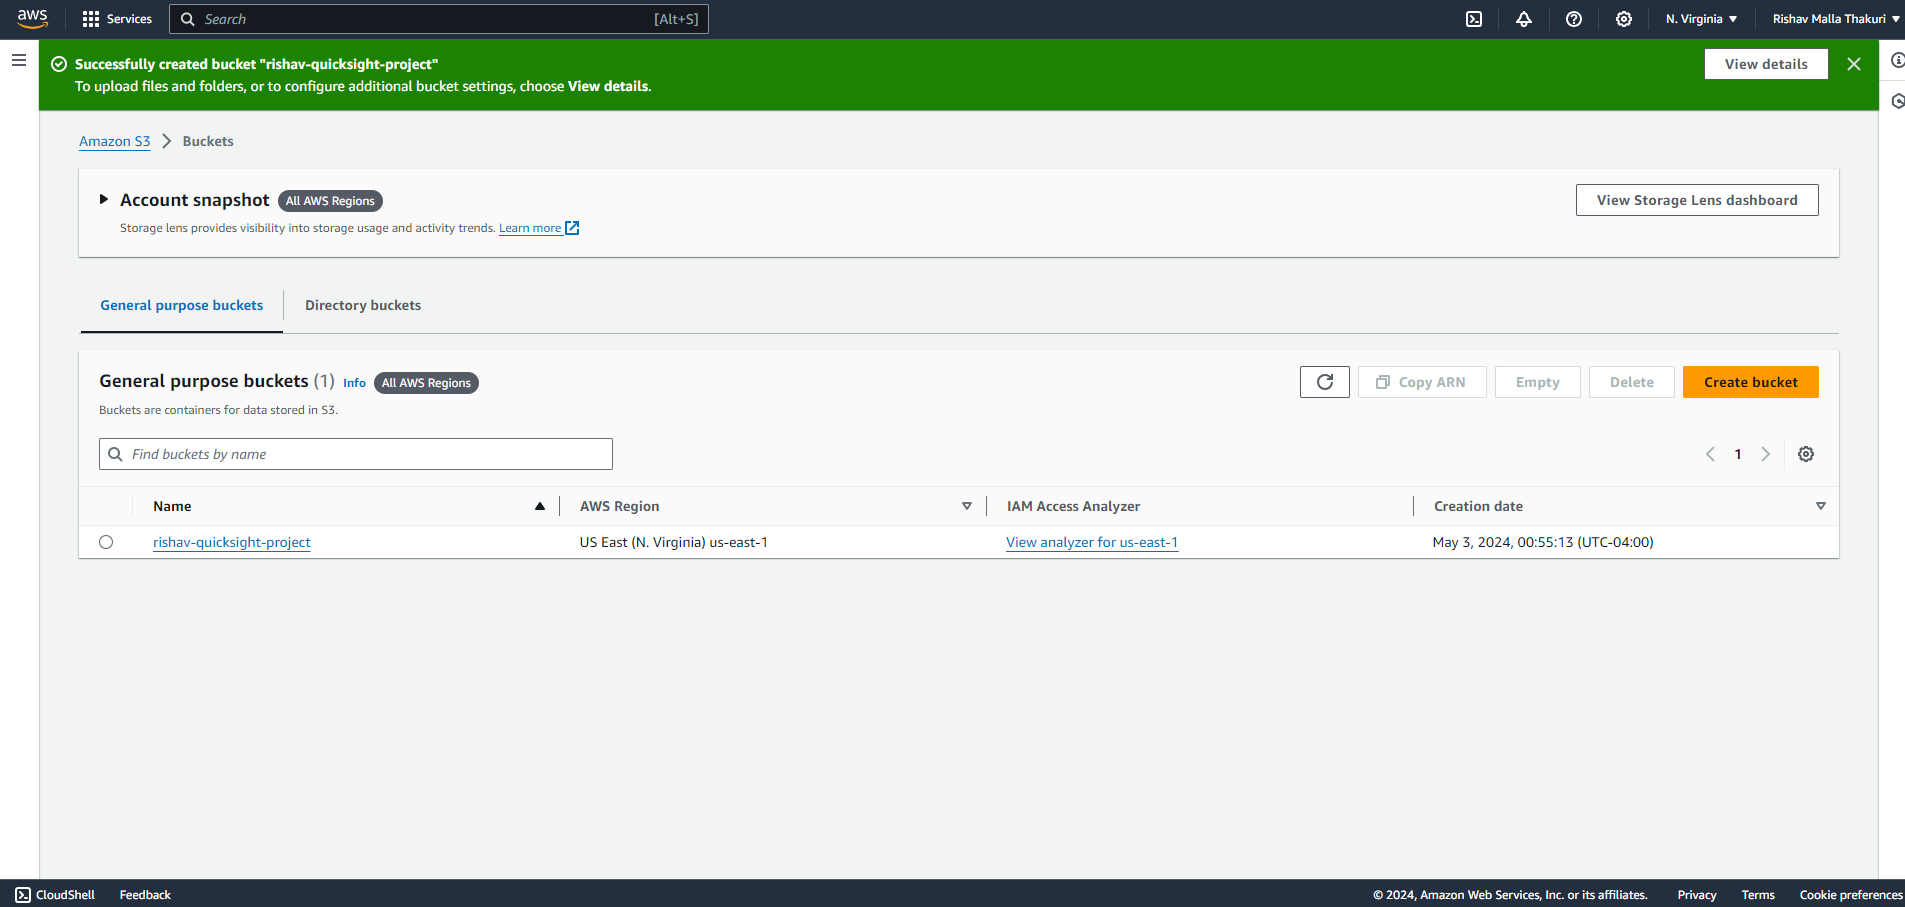
6. Click “Create bucket” to finalize.
Step 3: Storing the Dataset in Amazon S3
- Open the Amazon S3 console and navigate to the bucket you created.
2. Select the Bucket and Click on the “Upload” button.
3. Select the CSV file i.e Amazon Dataset files which you have recently downloaded.
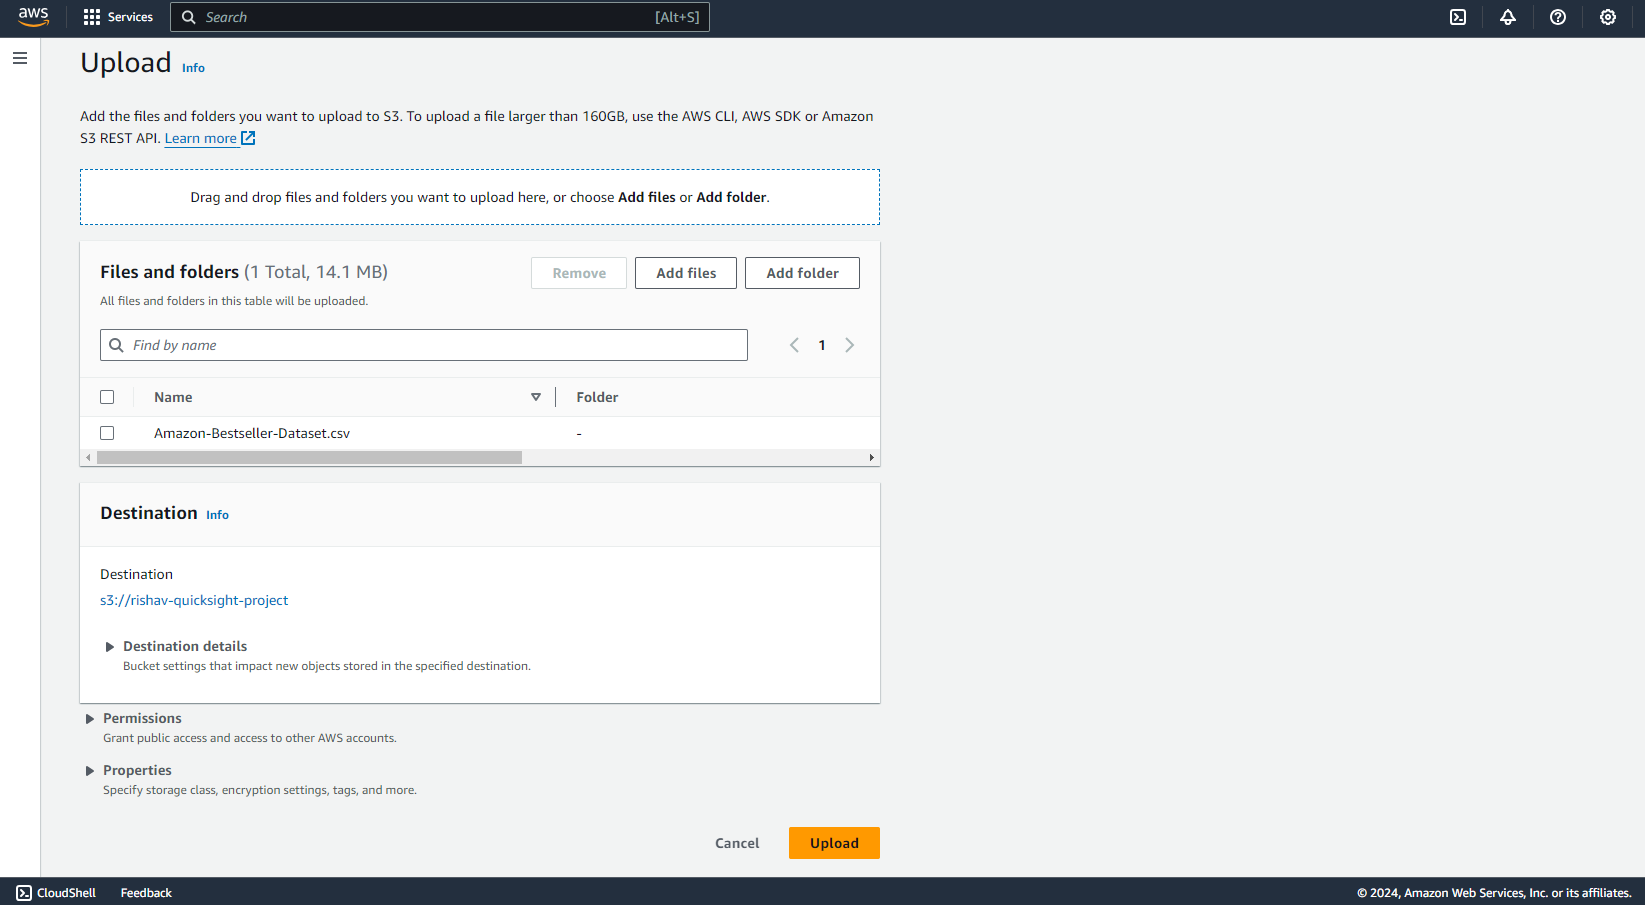
4. Also, Before uploading the manifest.json file. Modify the “manifest.json” file to include your bucket name.
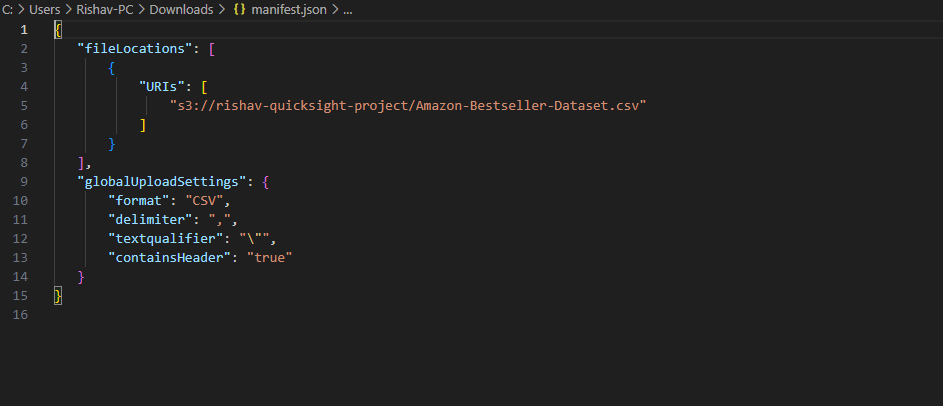
{
   "fileLocations": [
       {
           "URIs": [
               "s3://BUCKET-NAME/Amazon-Bestseller-Dataset.csv"
           ]
       }
   ],
   "globalUploadSettings": {
       "format": "CSV",
       "delimiter": ",",
       "textqualifier": "\"",
       "containsHeader": "true"
   }
}
5. After modifying the manifest.json. Just upload it to the bucket.

Step 4: Sign up for Amazon QuickSight and import the dataset
1. Open a New tab and Navigate to the Amazon QuickSight.
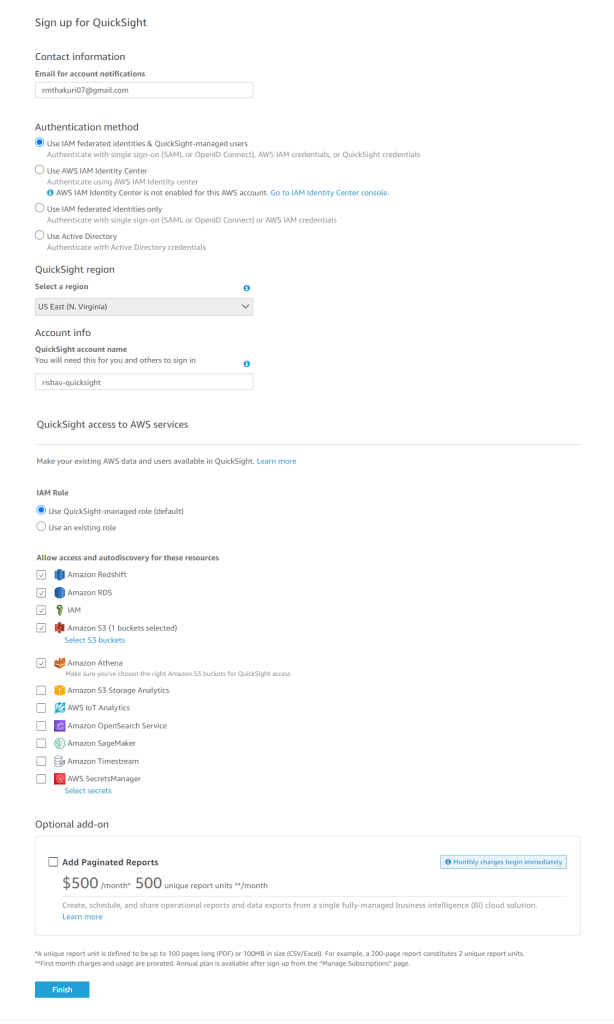
2. Sign up for Amazon QuickSight and select the S3 bucket you want to link.

3. Here, Enter your details and dont forget to select the S3 bucket you want to link to the Amazon QuickSight .
4. QuickSight account will be created after a few minutes.
5. After you logged in, Select Datasets from the left side navigation and Click on New Dataset.


6. Now, Enter the Data source name and Enter the URL of manifest file. To get the URL ,Just go the Amazon S3 bucket and Select Manifest file and there you will see the option Copy S3 URL.

7. Just Give any Name to Data Source and paste the url to the field and click on Connect.


Step 5: Start creating visualizations by selecting the fields from the dataset
- In the analysis interface, you’ll see a list of fields from your dataset on the left-hand side.
- Select the fields that you want to include in your visualization by clicking on them.
- With your fields selected, drag and drop them onto the canvas area in the center of the screen.

4. Choose the visualization type that best represents your data. For example, you can create a bar chart, line graph, pie chart, or table.
5. Here, we have used the Sort by Brand to find out the most Popular Brand.

6. Experiment with different visualization types and combinations to gain deeper insights into your data.
Conclusion:
By following these steps, we can start creating visualizations in Amazon QuickSight by selecting fields from your dataset, enabling you to uncover valuable insights and drive data-driven decision-making within your organization.